Nonprofit hospitals are exempt from most taxes, a benefit worth billions each year. In exchange for this investment, we expect hospitals to give back to their communities in financial assistance and community health programs. However, with little regulation in place, some hospitals spend far and above their tax breaks, while others fall millions short.
To better understand how hospitals are giving back to communities compared to their tax benefits, the Lown Institute examined the federal, state, and local tax benefits of more than 1,800 hospitals across twenty states, and compared them to hospital spending on meaningful community investment.
This analysis uses 2020-2022 data from the Internal Revenue Service (IRS) tax returns, Centers for Medicare and Medicaid Services (CMS) hospital cost reports, and local property assessment portals.
Overall, hospitals in 20 states collectively received $26 billion per year in tax breaks.
Income tax (42%) – The value of the federal income tax made up the largest proportion of the tax exemption for hospitals in these 20 states (32% of the total) at $8.3 billion. The value of the state income tax made up 10% of the total tax exemption, at $2.7 billion. Two states (OH, TX) do not have a state corporate income tax. 
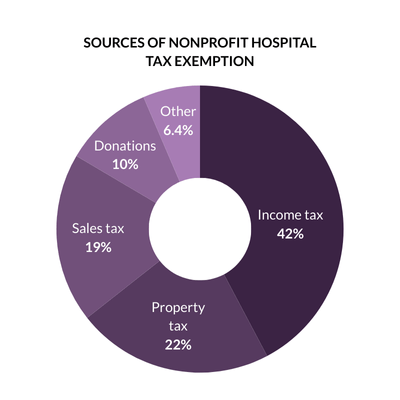
Six hospitals in our data set made at least $1 billion in a year from 2020-2022, according to CMS cost reports. One hospital (the Mayo Clinic in Rochester) reported making at least $1 billion in two of the three years.
Property tax (22%) – Property tax made up 22% of the tax exemption value for hospitals in these states, totaling about $5.8 billion. This value was concentrated among larger hospitals in major cities such as New York City, Boston, Orlando, Cleveland, and San Francisco. The 20 hospitals with the largest real estate property tax exemptions avoided nearly $1 billion in property taxes collectively.
State and local sales tax (19%) – State and local sales tax made up 19% of the total for hospitals in these states, totaling about $4.8 billion. Four states (CA, OR, LA, NC) did not exempt hospitals from sales taxes. In New York, sales taxes made up the largest portion of the tax exemption due to higher spending on supplies and high sales tax rates.
Tax-exempt donations (10%) – The value of tax-exempt donations made up 10% of the total at $2.7 billion. Five hospitals in our data set received at least $50 million in tax-exempt donations. Donations were reported on IRS Form 990, excluding government grants and in-kind donations.
Other tax benefits (6.4%) – Nonprofit hospitals benefit from being able to issue tax-exempt bonds because they can offer a lower interest rate to investors. The value of tax exempt bonds made up 6% of the total tax exemption, totaling $1.7 billion per year on average. Hospitals are exempt from paying federal unemployment tax as a result of their nonprofit status. The federal unemployment tax exemption made up 0.4% of the total tax exemption at $106 million per year on average. This element of the tax exemption is relatively low, because we assume that hospitals paid state unemployment taxes and took the full exemption from the maximum federal unemployment tax exemption rate.
Overall, nonprofit hospitals in 18 states owned a total of $170 billion in assessed real property value and avoided a total of $4.3 billion in real estate taxes. In eight states (California, Florida, Illinois, Massachusetts, New York, Ohio, Pennsylvania, and Texas) the total hospital property tax exemption exceeded $250 million.
The 20 hospitals with the largest property tax exemptions collectively avoided nearly $1 billion in property taxes, making up about one quarter of the total exemption.
Hospital |
City |
Value of property tax exemption |
Number of parcels |
Assessed property value |
New York-Presbyterian Hospital* |
New York |
$173 M |
69 |
$1.6 B |
The Mount Sinai Hospital* |
New York |
$78 M |
64 |
$724 M |
Massachusetts General Hospital |
Boston |
$75 M |
59 |
$3.0 B |
Tisch Hospital* |
New York |
$65 M |
197 |
$602 M |
Cleveland Clinic Main Campus |
Cleveland |
$61 M |
58 |
$747 M |
Stanford Hospital |
Stanford |
$52 M |
64 |
$4.4 B |
Boston Children’s Hospital |
Boston |
$49 M |
13 |
$1.9 B |
AdventHealth Orlando* |
Orlando |
$44 M |
182 |
$2.0 B |
Advocate Christ Medical Center |
Oak Lawn |
$41 M |
50 |
$404 M |
Brigham and Women’s Hospital |
Boston |
$36 M |
19 |
$1.5 B |
CPMC Van Ness Campus |
San Francisco |
$34 M |
4 |
$2.9 B |
Mount Sinai Morningside-West* |
New York |
$33 M |
6 |
$304 M |
Montefiore Hospital Moses Campus* |
Bronx |
$29 M |
72 |
$271 M |
Cedars-Sinai Medical Center |
Los Angeles |
$29 M |
43 |
$2.5 B |
Long Island Jewish Medical Center* |
New Hyde Park |
$29 M |
33 |
$266 M |
RUSH University Medical Center |
Chicago |
$28 M |
185 |
$406 M |
Beth Israel Deaconess Medical Center |
Boston |
$28 M |
15 |
$1.1 B |
The Johns Hopkins Hospital |
Baltimore |
$28 M |
10 |
$1.2 B |
Mount Carmel East* |
Columbus |
$27 M |
57 |
$329 M |
Houston Methodist Hospital |
Houston |
$27 M |
55 |
$1.1 B |
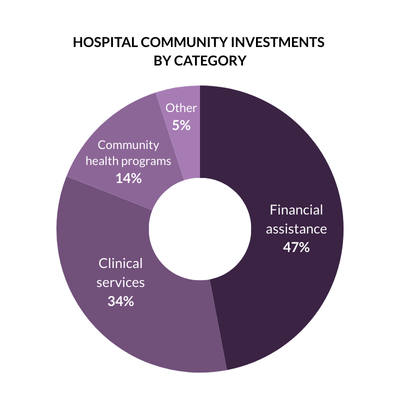
Overall, hospitals in 20 states gave $22.4 million per year in community investment.
Financial assistance (47%) – The largest proportion of community investment was spent on financial assistance (free and discounted care for eligible low-income patients), with hospitals spending $10.6 billion on this category.
Notably, in Texas, Tennessee, and North Carolina, at least 75% of total community investment went to financial assistance, which suggests that the need for financial assistance (due to not expanding Medicaid) is crowding out hospitals’ efforts to invest in health upstream.
Clinical services (34%) – Subsidized health services (clinical services that meet an identified community need, provided at a loss to the hospital) was the second-highest spending category, with $7.7B. These included service lines such as substance use treatment, rural health clinics, and behavioral health services. Despite these services making up the largest portion of community investment in many states, some hospitals provided limited details on the service lines to which this spending was attributed.
Community health programs & social determinants of health (14%) – Despite hospitals and public health experts putting increased emphasis on social drivers of health in recent years, relatively little spending went to community health improvement or community building activities. Together, these categories represented 14% of total community investment, around $3 billion in spending per year.
While the majority of hospitals in our data set had a fair share deficit, many others spent more on community investment than they received in tax breaks, what we call having a “fair share surplus.” Certain states are more represented on this list; fourteen of these hospitals are in New York State, Texas, Florida, or North Carolina.
Hospital | Tax exemption value | Community investment |
Fair share surplus |
North Shore University Hospital (Manhasset, NY) |
$52 M | $269 M | $217 M |
Long Island Jewish Medical Center (New Hyde Park, NY) |
$85 M | $237 M | $152 M |
Grady Memorial Hospital (Atlanta, GA) |
$56 M | $191 M | $135 M |
Mount Sinai Hospital (Chicago, IL) |
$11 M | $89 M | $78 M |
Lakeland Regional Health MC (Lakeland, FL) |
$36 M | $114 M | $78 M |
Baptist Memorial Hospital (Memphis, TN) |
$19 M | $93 M | $74 M |
One Brooklyn Health (Brooklyn, NY) |
$18 M | $92 M | $74 M |
CHRISTUS Spohn Hospital (Corpus Christi, TX) |
$20 M | $93 M | $73 M |
UPMC Presbyterian (Pittsburgh, PA) |
$46 M | $116 M | $70 M |
Lenox Hill Hospital (New York, NY) |
$36 M | $104 M | $67 M |
Rochester General Hospital (Rochester, NY) |
$38 M | $103 M | $65 M |
WakeMed Raleigh Campus (Raleigh, NC) |
$35 M | $99 M | $64 M |
Mount Sinai MC Of Florida (Miami Beach, FL) |
$21 M | $84 M | $64 M |
Methodist University Hospital (Memphis, TN) |
$46 M | $109 M | $63 M |
Memorial Hermann – Texas MC (Houston, TX) |
$77 M | $134 M | $57 M |
Novant Health New Hanover Regional MC (Wilmington, NC) |
$27 M | $83 M | $56 M |
Houston Methodist (Baytown, TX) |
$9 M | $64 M | $55 M |
Mount Sinai Beth Israel (New York, NY) |
$31 M | $85 M | $54 M |
UPMC Western Maryland (Cumberland, MD) |
$13 M | $66 M | $53 M |
New York-Presbyterian Queens (Flushing, NY) |
$17 M | $69 M | $53 M |
The majority of hospitals in our data set received more in tax breaks than they gave back in community benefits, what we call having a “fair share deficit.” Hospitals from Massachusetts, Pennsylvania, and Ohio make up half of these highest-deficit hospitals.
Many of these hospitals have large deficits due to their size and wealth, which result in enormous tax benefits. For example, five of these hospitals reported at least $1 billion in net income in one year, five own at least $1 billion in real estate property value, and five received at least $50 million in donations as a benefit of tax-exempt status.
Others are outliers due to their particularly low community investment; five of these hospitals spent less than 1% of their expenses on community investment.
Hospital (city, state) |
Tax exemption |
Community Investment |
Fair share deficit |
Notes |
Massachusetts General Hospital |
$415 M |
$90 M |
-$325 M |
Over $200M in tax-exempt donation value; $1B real estate property value |
Mayo Clinic Hospital, Saint Marys Campus |
$338 M |
$77 M |
-$260 M |
Over $1B in net income 2021 & 2022; $40M donation value |
Hospital of the University of Pennsylvania |
$255 M |
$8 M |
-$247 M |
Over $300M average net income; $100M donation value |
Brigham and Women’s Hospital |
$292 M |
$66 M |
-$226 M |
Over $200M in tax-exempt donation value; $1B real estate property value |
Cleveland Clinic Main Campus |
$307 M |
$101 M |
-$207 M |
Over $1B in net income; over $50M donation value; over $700M real estate property value |
Evanston Hospital |
$198 M |
$47 M |
-$152 M |
Over $1B net income in 2021 |
Carle Health Methodist Hospital |
$141 M |
$11 M |
-$120 M |
Over $1B net income in 2020 |
IU Health Methodist Hospital |
$231 M |
$102 M |
-$129 M |
Over $1B net income in 2020 |
Nationwide Children’s Hospital |
$169 M |
$48 M |
-$121 M |
Over $300M average net income; $40M donation value |
Cedars-Sinai Medical Center |
$218 M |
$114 M |
-$104 M |
Over $400M average net income; over $1B real estate property value; $50M donation value |
Orlando Health Orlando Regional Medical Center |
$215 M |
$114 M |
-$101 M |
Over $400M average net income; over $1B real estate property value |
Boston Children’s Hospital |
$143 M |
$43 M |
-$100 M |
Over $1B real estate property value; $50M donation value |
Tisch Hospital |
$288 M |
$195 M |
-$93 M |
Over $500M average net income; $500M real estate property value; $30M donation value |
Cook Children’s |
$110 M |
$18 M |
-$91 M |
Over $300M average net income |
Salem Hospital |
$103 M |
$12 M |
-$91 M |
Over $30M donation value |
Milton S. Hershey Medical Center |
$103 M |
$18 M |
-$84 M |
Over $200M average net income; $400M real estate property value |
Cincinnati Children’s Hospital |
$109 M |
$29 M |
-$81 M |
Over $200M average net income; $30M donation value |
University of Michigan Health – West |
$81 M |
$5 M |
-$76 M |
Over $200M average net income |
Froedtert Community Hospital – New Berlin |
$76 M |
$171 K |
-$75 M |
Over $200M average net income |
WellSpan York Hospital |
$86 M |
$12 M |
-$74 M |
Over $200M average net income; over $300M real estate property value |
In many cases, hospitals with large fair share deficits and hospitals with large fair share surpluses are in the same metro areas.
Fair share deficit hospital | Fair share surplus hospital | |||
Metro area | Hospital | Deficit | Hospital | Surplus |
Atlanta | Arthur M. Blank Hospital | -$60 M | Grady Memorial Hospital | $135 M |
Baltimore | University of Maryland MC | -$42 M | Mercy Medical Center | $36 M |
Baton Rouge | Our Lady of the Lake Regional MC | -$65 M | Ochsner Medical Center | $14 M |
Boston | Massachusetts General Hospital | -$325 M | Boston Medical Center | $48 M |
Chicago | Evanston Hospital | -$152 M | Mount Sinai Hospital | $78 M |
Houston | Texas Children’s Hospital | -$27 M | Memorial Hermann Texas MC | $57 M |
Los Angeles | Cedars-Sinai Hospital | -$104M | MLK Community Hospital | $44 M |
New York | Tisch Hospital | -$93 M | One Brooklyn Health | $74 M |
Tampa | St. Joseph’s Hospital | -$48 M | Tampa General Hospital | $19 M |
Federal and state policymakers could take the following actions to improve transparency and accountability around hospital community investments:
Improve reporting requirements to include spending on priority health needs (ideally broken out by program and health need) and more details about financial assistance and extraordinary collection actions.
Establish standards for financial assistance, such as income eligibility thresholds, presumptive eligibility, and patient screening requirements.
Set a spending target for financial assistance and programs to address community health needs identified in the Community Health Needs Assessment (CHNA), based on hospitals’ size, financial health, and previous spending.
States and localities may also consider:
Leveraging Certificate of Need regulations to set community investment targets as a condition of expansion
Implementing payment in lieu of taxes programs to recoup foregone property taxes
Delineating requirements for hospitals to involve community groups in the CHNA process to encourage stronger hospital-community partnerships
Patterns in fair share spending reflect deeper systemic issues in our hospital system that require more transformative solutions. In the long term, policymakers should look to align incentives for hospitals with those of communities by:
Supporting “total cost of care” models that equalize reimbursement rates across payers and set global budgets. We cannot expect hospitals to care for all patients equally when they’re paid more for privately-insured patients.
Increasing reimbursement for underfunded high-need services, such as behavioral healthcare, substance use treatment, and primary care.
Increasing insurance coverage through Medicaid expansion and cost-sharing limits on marketplace plans, to improve the financial health of fair share surplus hospitals, reduce medical debt, and allow all hospitals to invest more in programs to improve community health upstream.
This analysis builds on previous research to calculate fair share spending—the difference between hospitals’ meaningful community investment and the value of their tax exemptions—in twenty states. We used three years of data to provide a more comprehensive picture and even out year-to-year income fluctuations.
We include all hospitals in 20 states with both IRS Form 990 and CMS cost report data available from 2020-2022. We removed hospitals that closed, converted to for-profit, or were removed from Care Compare as of September 2024; however, there may be updates since then for which we have not accounted. We do not include certain hospitals that are publicly-owned and do not file a 990, nor do we include certain children’s or cancer hospitals without cost report data, which may underestimate the fair share deficit.
We include the following IRS categories of community benefit most likely to have a direct and meaningful impact on community health, which we refer to as meaningful community investment:
Financial assistance – Free and discounted care provided to patients eligible for financial assistance under the hospital’s policy. Reported as the cost to the hospital (not charges). Bad debt is not included.
Subsidized health services – Clinical services that meet an identified community need and are provided despite a loss to the hospital. Examples include primary care clinics, addiction treatment, and neonatal care.
Community health improvement services – Programs provided by the hospital for the purpose of improving health. Examples include health fairs, free immunizations, and interpreter services. Includes the operating costs of community benefit programs.
Cash and in-kind contributions – Contributions made to other nonprofits to improve health. Contributions to affiliated medical schools or physician groups and other hospitals in this study were excluded.
Community building activities – Programs that address the social drivers of health, such as housing, community advocacy, and environmental initiatives, as reported on Schedule H Part II. Although this category is not always considered a community benefit, we include it because addressing the social drivers of health is critical for improving long-term community health.
Medicaid shortfall is the gap between hospitals’ costs for serving Medicaid beneficiaries and payments received for these patients. While Medicaid shortfall represents nearly half of reported community benefit spending, researchers have expressed concerns about including it as a community benefit:
Health professions education and research were not included because it is not clear that these investments have a direct impact on community health. Only about one-quarter of resident physicians report practicing in underserved areas after their training and only 35% go on to practice primary care. Additionally, hospitals are already reimbursed for trainees through medical education payments they receive from Medicare, not all of which are reported on Form 990. While research funding is a public good, it is unlikely that a hospital’s research has a direct impact on community health.
Our calculation of hospital tax exemption value draws from six previous analyses and includes the following categories:
Federal corporate income tax – Federal corporate income tax rate (21%) applied to net income from hospital cost reports, adjusted for prior year losses and other taxes paid
State corporate income tax – State-specific corporate tax rate applied to net income from hospital cost reports, adjusted for prior year losses and other taxes paid
State & local sales tax – State and local tax rates applied to supply expenses from American Hospitals Association survey
Property tax – Local property tax rates applied to real property values from local assessment portals and value of equipment/inventory from cost reports
Tax-exempt bonds – Difference between corporate and nonprofit bond interest rates, applied to outstanding bond liabilities from Form 990
Tax-exempt charitable donations – Value of tax-exempt donations from Form 990, excluding government grants and in-kind donations, multiplied by the estimated marginal tax rate of donors
Federal unemployment tax exemption – Federal unemployment tax rate applied to the first $7,000 of full time employee total
See Appendix for more methodology details.
CRAIN’S GRAND RAPIDS
DENVER BUSINESS JOURNAL
BECKER’S HOSPITAL REVIEW
Media inquiries should be directed to Aaron Toleos, vice president of communications for the Lown Institute, at atoleos@lowninstitute.org.