
See our detailed methodology for how we created each metric, grade, and ranking for the Lown Hospitals Index.
DownloadThe Lown Hospitals Index for Social Responsibility is based on hospitals’ grades in equity, value, and outcomes. The Index includes over 50 metrics, including several that have never been used before.
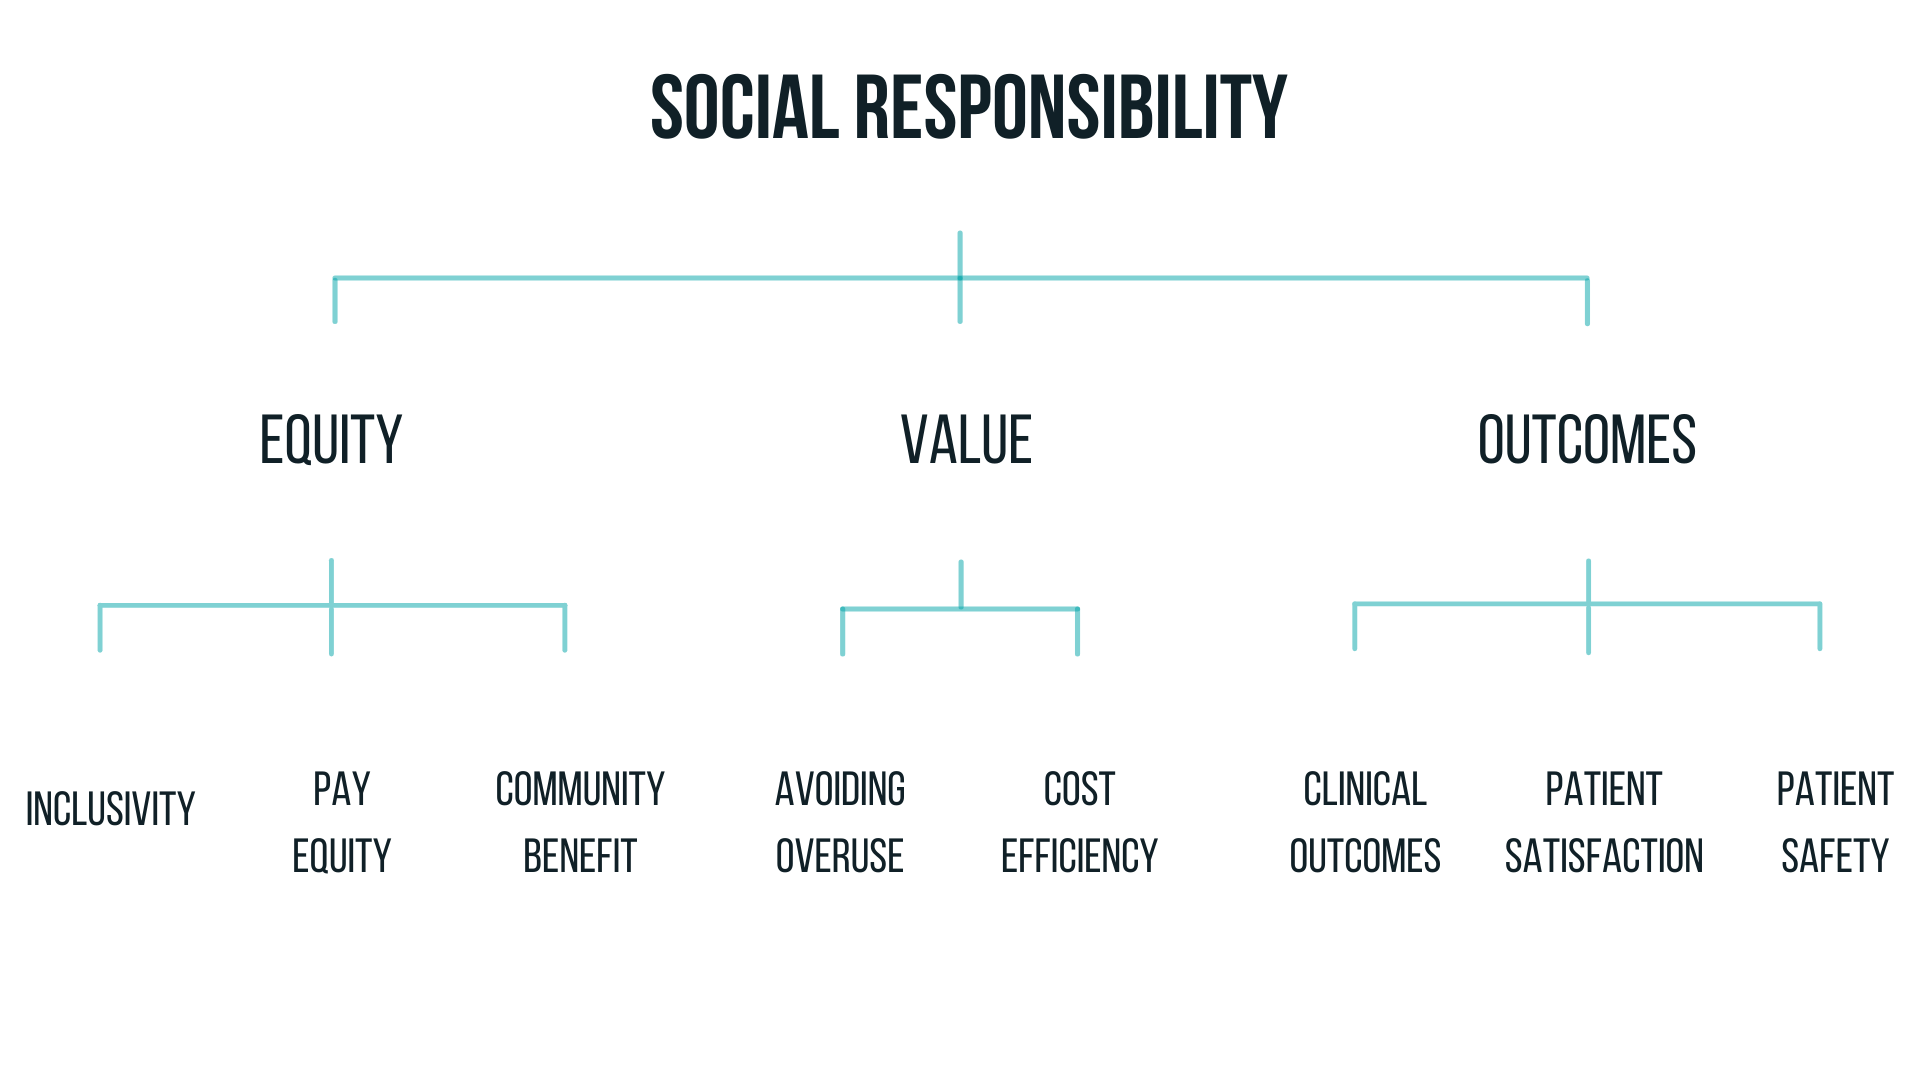
The equity grade combines assessments of community benefit spending, pay equity, and inclusivity to evaluate hospitals’ commitment to community health and civic leadership. Pay equity, community benefit, and inclusivity were weighted at 20%, 40%, and 40% respectively, to create the overall equity grade.
The pay equity component measures the difference in compensation of hospital executives compared to housekeeping workers at hospitals.
We obtained data for Chief Executive Officer (CEO) compensation from three different sources: the Securities and Exchange Commission’s (SEC) database, public payroll data, and IRS 990 filings from fiscal year ending 2022. When CEO pay was unavailable, this information was imputed (estimated) based on hospital characteristics such as bed count and revenue. For hospitals within systems (two or more hospitals), we distributed the system CEO’s salary among the constituent hospitals using the percentage of total revenue each hospital generated.
We obtained average housekeeping wages from the CMS Healthcare Cost Report Information System (HCRIS). We included both housekeeping and housekeeping under contract wage categories in our review, deferring to the category which had the higher total hours logged. For hospitals that had no housekeeping wage incomplete wage index information in HCRIS for 2021-2023, we substituted an average of housekeeping HCRIS wage index data from hospitals in the same state and with the same urban or rural status. We then estimated hourly wages for CEOs based on the work hours listed in their IRS forms and calculated a ratio of CEO pay to average worker pay.
The community benefit metric measures hospital spending on financial assistance and other community health initiatives, as well as their service of Medicaid patients. Community benefit is a composite of three details: Financial assistance, Medicaid revenue, and Community investment. For hospitals with data available for all three metrics, each metric was weighed equally in the composite at ⅓ of the total score. For hospitals with data for two of the metrics available, each metric was weighed equally in the composite as half of the total score.
Financial assistance, also known as charity care, is free or discounted care provided on the basis of the patient’s financial situation. We measured financial assistance as a share of total expenses using the Centers for Medicare and Medicaid’s Hospital Cost Reports (HCRIS) for Fiscal Year Ending 2022. Financial assistance was adjusted for hospital patient services margin, using HCRIS data from 2020-2022 on the assumption that financially healthy hospitals should be able to give back more in assistance. Medicaid patient revenue was measured as a proportion of net patient revenue using HCRIS data from 2022. For hospitals without financial assistance or expenses data for 2022, we used HCRIS data from the most recent available year.
Hospital spending on community investment, as a share of total expenses, was calculated using Internal Revenue Service (IRS) tax filings from 2022, or the most recent year available. This metric includes a subset of community benefit categories that we deemed to be the most meaningful for community health: subsidized health services, such as free clinics, some emergency services, substance use treatment, and other services provided at a loss to the hospital; community health improvement activities such as health fairs, health education classes, immunizations, and interpreter services; contributions to community organizations; and community building activities that help increase the capacity of the community to address health needs and often address the social drivers of health, such as education, air quality, and access to nutritious food.
The inclusivity component evaluates the extent to which a hospital’s patient population reflects the demographics of the community in which it is located, based on race, income, and education levels. To create this metric, we used claims from the Medicare Provider Analysis and Review file (MEDPAR) and the U.S. Census Bureau’s American Community Survey from 2023. The MEDPAR database includes both Medicare fee-for-service and Medicare Advantage patients.
Each hospital’s inclusivity score shows how the demographics of the hospitals’ community area (who the hospital could serve) compares to their actual patient population (who the hospital does serve). We created a “community area” around each hospital based on the distance from where their Medicare patients currently travel (see methodology paper for more details). We used OpenStreetMap to measure travel time for the community area radius.
To calculate community area demographics, we applied 2023 five-year estimates from the US Census Bureau’s American Community Survey data for people over the age of 65 on race, income, and education levels within zip codes in the community area, with zip codes weighted by their distance from the hospital. These demographics were then compared to the zip code demographics from where the hospital’s Medicare patients came from.
Hospitals received higher scores if they had higher patient counts from zip codes with greater proportions of non-white residents, residents with lower incomes, and residents with lower levels of education, compared to their community area. Inclusivity by race, income, and education were weighted equally to create the overall inclusivity score. Hospitals in racially homogenous areas (96% or more of one racial/ethnic group) were only scored on inclusivity by income and education. Hospitals receive an “A” grade if their patient demographics are near equal to their community demographics.
The value of care category reflects hospitals' avoidance of unnecessary care and ability to achieve good outcomes without overspending. The value category is based on two components, avoiding overuse and cost efficiency, weighted 40% and 60%, respectively, to create the overall value grade.
Overuse (also known in the clinical community as low-value care) is the delivery of healthcare services that are more likely to harm than benefit the patient. The component comprises overuse rates of 12 common low-value tests and procedures, chosen based on their validation in previous research on measuring overuse. Hospitals’ overuse score for each service is based on the rate of overuse as well as the volume of overuse. For the overuse composite ranking, more weight was placed on the services that make up the larger share of overuse.
To create this metric, we used Medicare claims data from January 1, 2021 – December 31, 2023. We included Medicare fee-for-service claims for 2021-2023 and Medicare Advantage claims for 2020-2022, the most recent time periods available.
For Acute Care Hospitals, we ranked hospitals on all 12 services (see below). Acute Care Hospitals with data available for six or more services were ranked on avoiding overuse. Critical Access Hospitals were ranked on carotid artery imaging for fainting and head imaging for fainting, as these services had adequate volume for most critical access hospitals. Critical Access hospitals with data for both of these services were given an avoiding overuse ranking.
Low-value tests and services:
Arthroscopic knee surgery – Surgery to remove damaged cartilage or bone in the knee using an arthroscope (tiny camera). Defined as overuse for patients with osteoarthritis or “runner’s knee” (damaged cartilage). Excluding patients with meniscal tears.
Carotid artery imaging for fainting – A test to screen for carotid (neck) artery disease. Considered overuse for patients where syncope (fainting) is the primary diagnosis, and there is no history of syncope in the past two years. Excluding patients with stroke or mini-stroke, retinal vascular occlusion/ischemia, or nervous and musculoskeletal symptoms. Both critical access and Acute Care hospitals are ranked on this measure.
Carotid endarterectomy – Procedure to remove plaque buildup from a carotid (neck) artery in a patient to prevent stroke. Considered overuse when performed on female patients without stroke symptoms or history of stroke.
Colonoscopy screening – Test for asymptomatic colorectal cancer. Defined as overuse for patients over 85 years old or performed more than once in a nine-year period. Excluding patients with symptoms of colorectal cancer and patients at high risk of colorectal cancer.
Coronary artery stenting – Also known as percutaneous coronary intervention. Procedure to place a stent or balloon in a coronary artery using a catheter. Also includes procedures where the artery is opened but a stent is not inserted. Defined as overuse when performed on patients with stable heart disease (not having a heart attack or unstable angina). Excluding patients with past diagnosis of unstable angina.
EEG for fainting – A test of the electrical activity of the brain. Considered overuse for patients where syncope (fainting) is the primary diagnosis, and there is no history of syncope in the past two years.
EEG for headache – A test of the electrical activity of the brain. Defined as overuse for patients with headache as the primary diagnosis on the claim and no history of headache in the past two years. Excluding patients with epilepsy and recurrent seizures, convulsions, and abnormal involuntary movements.
Head imaging for fainting – Considered overuse for patients where syncope (fainting) is the primary diagnosis, and there is no history of syncope in the past two years. Excluding patients with epilepsy or convulsions, cerebrovascular diseases, head or face trauma, altered mental status, nervous and musculoskeletal system symptoms, and history of stroke. Both Critical Access and Acute Care hospitals are ranked on this measure.
Inferior Vena Cava (IVC) filter – Procedure to place a filter (a medical device) in the large vein in the abdomen to prevent blood clots from moving to the lungs. Considered overuse for all patients except those with history of multiple pulmonary embolism.
Renal artery stenting – Procedure to place a stent or balloon in the renal (kidney) artery. Considered overuse for patients with high blood pressure or plaque buildup in the artery. Excluding patients that had diagnosis of fibromuscular dysplasia of the renal artery (abnormal twisting of the blood vessels).
Spinal fusion/laminectomy – Procedure to fuse vertebrae together (spinal fusion) or remove part of a vertebra (laminectomy). Defined as overuse for patients with low-back pain, excluding patients with radicular symptoms, trauma, herniated disc, discitis, spondylosis, myelopathy, radiculopathy, radicular pain or scoliosis.
Vertebroplasty – Procedure to inject cement into the vertebrae to relieve pain from spinal fractures. Considered overuse for patients with spinal fractures caused by osteoporosis. Excluding patients with bone cancer, myeloma, or hemangioma.
The cost efficiency metric is a ratio of hospitals’ mortality rates compared to their Medicare costs. Hospitals with the lowest mortality and the lowest costs received the best scores in cost efficiency. Cost efficiency is comprised of two details, 30-day cost efficiency and 90-day cost efficiency, which are weighed equally to create the composite ranking.
For mortality, we used hospitals’ risk-standardized 30- and 90-day mortality for Medicare patients hospitalized between 2020 and 2022. For cost, we used 30- and 90-day total risk-standardized Medicare payments for patients hospitalized in 2020 to 2022. Payments were standardized for hospital patient risk (the conditions that hospital patients have as well as the procedures they received), so that hospitals with sicker patients were not punished for spending more to treat them. Payments were also adjusted for patient survival and for Medicare's regional cost differences.
For each hospitalization, we found the claim payment amount in all claims within 30 or 90 days from the admission date. These claims included: inpatient, outpatient, carrier, skilled nursing facility, home health agencies, durable medical equipment, and hospice claims. We excluded any claims where Medicare denied the payment. Transfers were excluded. Hospitalizations with probable or confirmed COVID-19 were excluded.
Medicare adjusts its payment amounts to hospitals and other providers based on various geographic factors. To account for this, we calculated standardized payments using the Virtual Research Data Center’s 2021 public use file of Hospital Referral Regions (HRR) standardized ratio tables for patients over 65. As the 2022 and 2023 data were not available, we re-used 2021 HRR estimates for 2022 and 2023 claims.
Our goal for the cost efficiency score was to reward hospitals with low mortality rates and low costs and give the lowest scores to hospitals with high mortality rates and high costs. We also decided to bias our scores to give hospitals with high costs and low mortality a higher score than hospitals with low costs and high mortality. This is because we believe that if there is a trade-off between costs and mortality, we should favor better mortality rates compared to lower costs.
The patient outcomes category reflects a hospital's performance as it relates to their patients' health and experience of care. This category is calculated from three components: clinical outcomes, patient safety, and patient satisfaction. Critical Access Hospitals were not ranked on patient safety due to lack of data. For Acute Care hospitals, the components were weighted as such: clinical outcomes (62.5%), patient safety (25%), and patient satisfaction (12.5%). For Critical Access hospitals, clinical outcomes was weighted 83.3% and patient satisfaction was weighted 16.7%.
The clinical outcomes component measures how well the hospital keeps patients alive and prevents return trips to the hospital, over various periods of time. All of the measurement and results for Acute Care and Critical Access Hospitals was performed separately on the split populations. For mortality and readmissions metrics, hospitalizations with probable or confirmed COVID-19 were excluded.
Using Medicare claims, we evaluated hospital clinical outcomes based on mortality and readmissions. We included Medicare fee-for-service claims for 2021-2023 and Medicare Advantage claims for 2020-2022, the most recent time periods available. The clinical outcomes metric is composed of risk-standardized rates of mortality and readmission, weighted at 80% and 20% respectively.
Mortality included rates of in-hospital, 30-day, and 90-day mortality. We chose these mortality endpoints to cover measurements in CMS' inpatient quality reporting programs as well as more extended periods when mortality is a function of both hospital and community. We also included risk-standardized rates of 7- and 30-day readmission, to include both a shorter interval that would reflect inpatient care quality, and longer follow-up that would reflect post-hospital community support.
New to the Lown Index in 2024 was unplanned hospital visits post outpatient surgery within 7 days, which includes inpatient admissions directly following surgery as well as any ED visit, observation stay, or unplanned inpatient admission following discharge from the hospital outpatient department (defined using CMS’s unplanned admission algorithm). We do not report unplanned hospital visits post outpatient surgery for Critical Access Hospitals, as the majority of these hospitals do not have high outpatient volumes.
Mortality, readmissions, and unplanned hospital visit rates rates were risk adjusted using the Risk Stratification Index (RSI), a Lown Institute-specific version of a machine-learning algorithm in the public domain that has been validated on multiple national, state-based, and hospital-based datasets. RSI has been shown to predict outcomes with greater discriminatory accuracy compared with other publicly available risk adjustment tools, by adjusting outcomes for numerous patient conditions and procedures. This allows us to better compare outcomes across patients that have the same medical needs. In addition to the patient conditions in RSI, we accounted for differences in hospital volume, patient risk, Medicare/Medicaid dual-eligibility rates, and types of services performed.
The patient safety component measures how well hospitals avoid preventable patient safety errors. We used well-established indicators provided by CMS on its Care Compare website for hospitalizations–such as rates of pressure ulcers, accidental punctures, and central intravenous line infections–for hospital admissions in 2020-2023.
We included the CMS composite measure (PSI-90) from July 2021 to June 2023, which comprises 10 separate indicators of patient safety. We used five hospital-acquired infection (HAI) measures from April 2023 to March 2024 from CMS. We included a reliability adjustment for the HAI measures using the reported numerator and denominator counts from Care Compare. For a patient safety overall score, hospitals had to have had at least three of the PSI-90 or HAI results.
The six detailed metrics (PSI-90 composite and five HAI measures) were weighted equally to formulate the overall patient safety component score. Like CMS, we excluded Critical Access hospitals from this metric due to a lack of available data.
The patient satisfaction component measures aspects of the hospital experience as reported by patients. For this component, we used CMS's annual Hospital Consumer Assessment of Healthcare Providers and Systems (HCAHPS) survey from 2023 to 2024 to give a rating of patient experience across 10 factors, including hospital quietness, cleanliness, healthcare staff responsiveness, and communication. We took the average of the 10 linear mean scores of these factors published on the 2024 Care Compare site. As with all Lown Index measures in 2024 and onward, Acute Care and Critical Access hospital rankings were separate so each type of hospital was compared to their peers.
Care Compare did not report scores for hospitals that had fewer than 100 responses. We chose to include hospitals with between 50 and 100 responses after data analysis indicated that the imputation of these scores would be reasonable to account for CMS’s mean calculations and adjustment. We calculated scores for these hospitals by extrapolating to the nearest median score of hospitals with similar survey responses.
We have tools available to help high-performing hospitals and systems share the good news. Learn more

THESE RANKINGS PROVIDE A MUCH-NEEDED AND LONG-OVERDUE FRAME THROUGH WHICH TO TRULY JUDGE THE VALUE OF OUR HOSPITALS."